
A currency pair can spend days moving quietly, then travel 150 pips in an hour after one inflation release or central bank comment. That is why forex market trends are not just lines on a chart. They are the market’s running verdict on growth, interest rates, risk, and the relative strength of one economy against another.
- What Forex Market Trends Actually Show
- The Forces Behind Major Forex Market Trends
- Interest rate expectations lead the conversation
- Inflation and jobs data can change the trend quickly
- Risk sentiment changes demand for safe havens
- Read the Chart Without Ignoring the Story
- A Practical Process Before Taking a Trade
- When the Trend Is Not Your Friend
- Build a Trend Routine You Can Repeat
For active traders, the goal is not to predict every candle. It is to identify what is driving the larger move, then decide whether a technical setup supports that story or fights it. A clean breakout in EUR/USD means something very different when the Federal Reserve is turning more hawkish than when markets are pricing rate cuts.
What Forex Market Trends Actually Show
A forex trend is a sustained direction in a currency pair, but the reason behind it matters as much as the direction. If USD/JPY is rising, the move may reflect higher U.S. Treasury yields, a stronger dollar, weak Japanese yen demand, or several forces happening at once. Looking only at price can show where the market is moving. Combining price with macro context helps explain why traders may continue to support that move.
Trends usually appear across three timeframes. A long-term trend can last months and is often shaped by monetary policy and economic growth. A medium-term trend may last several weeks, driven by changing expectations around jobs, inflation, or political risk. Short-term trends can unfold within a session, especially around major data releases, but they are more vulnerable to false breaks and sudden reversals.
This is where many traders get caught. A five-minute chart may show a convincing selloff, while the daily chart remains firmly bullish. Neither chart is automatically wrong. They simply answer different trading questions. Scalpers may trade the intraday pullback, while swing traders may wait for it to become a better buying opportunity.
The Forces Behind Major Forex Market Trends
Interest rate expectations lead the conversation
Currencies tend to respond to the expected path of interest rates, not just the rate currently in place. When traders believe the Fed will keep rates higher for longer, the dollar often gains support because dollar-denominated assets may offer more attractive returns. When markets begin pricing faster cuts, that support can fade.
The same logic applies to the European Central Bank, Bank of England, Bank of Japan, Reserve Bank of Australia, and other major central banks. The key word is relative. A rate hike does not guarantee a currency will rise if another central bank is expected to tighten even more aggressively.
Watch the language around policy as carefully as the actual decision. Terms such as “data dependent,” “restrictive,” “upside inflation risks,” or “room to ease” can move price because they reshape expectations before the next meeting even arrives.
Inflation and jobs data can change the trend quickly
Inflation tells markets whether a central bank has room to cut rates. Employment data provides a read on economic resilience. Strong inflation and strong jobs data can push rate-cut expectations further out, often supporting the related currency. Softer numbers can have the opposite effect.
Still, the market reaction depends on what was expected. A high inflation number that matches forecasts may create less volatility than a slightly lower number that surprises traders who were positioned for an upside beat. Forex is a market of expectations, not headlines in isolation.
For dollar pairs, U.S. CPI, PCE inflation, nonfarm payrolls, retail sales, and Fed communications deserve a place on every trader’s calendar. For EUR/USD, GBP/USD, and USD/JPY, the equivalent releases from Europe, the United Kingdom, and Japan can be just as important.
Risk sentiment changes demand for safe havens
When investors are confident, higher-yielding or growth-linked currencies may attract demand. When geopolitical tensions rise, equities sell off, or recession fears intensify, capital can move toward traditional safe-haven assets such as the U.S. dollar, Japanese yen, and Swiss franc.
There is no fixed rule that works every time. The dollar can rise during risk aversion, but it can also weaken if the source of concern is clearly U.S.-specific. Gold, oil, bond yields, and stock indexes provide useful context because forex rarely moves in a vacuum.
Commodity currencies also deserve attention. The Australian dollar can react to China-related growth signals and industrial commodity demand. The Canadian dollar can be sensitive to oil prices. These relationships are not perfect trade signals, but they can explain why a pair is ignoring an otherwise reasonable technical setup.
Read the Chart Without Ignoring the Story
Fundamentals can set direction, but charts help traders manage timing and risk. Start with market structure. In an uptrend, look for higher highs and higher lows. In a downtrend, look for lower highs and lower lows. This simple process is often more useful than loading a chart with too many indicators.
A 50-period or 200-period moving average can help show trend bias, particularly on the four-hour and daily charts. If price is consistently holding above a rising moving average, buyers may remain in control. If it breaks below, the trend is not automatically finished, but traders should check whether structure has also changed.
RSI can add context. During a strong uptrend, RSI may remain elevated for longer than expected. Selling simply because RSI reaches 70 can be expensive. Instead, look for divergence, a break in support, or a lower high in price before assuming momentum has turned.
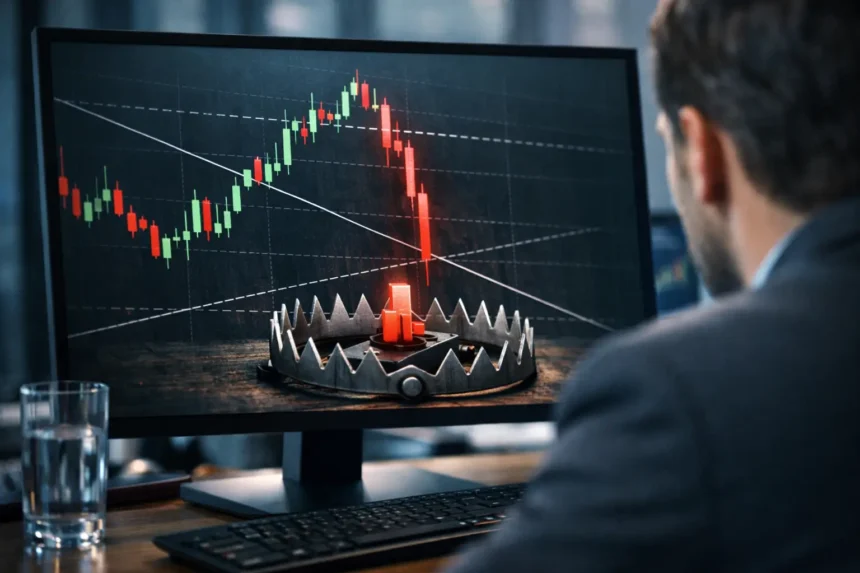
Support and resistance matter because they show where decisions have already been made. A breakout above a major weekly level can signal trend continuation, but only if price holds above that area after the initial burst. If it quickly falls back below, the market may be trapping late buyers.
A Practical Process Before Taking a Trade
Before entering a position, build a short case for the trade. First, define the direction on the daily and four-hour charts. Next, check the economic calendar for events that could invalidate a technical idea. Then identify the entry area, the stop-loss level, and the point at which the trade idea is wrong.
A trader considering a long USD/JPY position, for example, might see a daily uptrend, rising U.S. yields, and price holding above prior resistance. That is a stronger case than buying because one green candle appeared after an RSI signal. But if a Bank of Japan meeting is due within hours, position size and volatility risk need extra attention.
Risk management is what keeps a good market read from becoming a damaging trade. Trend-following setups often require wider stops because pullbacks are normal. Smaller position sizing may be necessary. Countertrend trades can offer tight entries, but their probability may be lower when major fundamentals remain aligned with the trend.
When the Trend Is Not Your Friend
Trend trading is effective when price, momentum, and the macro narrative point in the same direction. It is less effective in a range-bound market, where support and resistance repeatedly contain price. During these periods, moving-average signals may produce whipsaws and breakouts may fail.
The first question should be whether the market is trending at all. If EUR/USD has spent weeks inside a narrow range ahead of key central bank decisions, patience can be a strategy. Waiting for confirmation is not missed opportunity. It is a decision to avoid paying for noise.
Also be careful with “obvious” consensus trades. When nearly everyone expects the same outcome, much of that view may already be priced in. A currency can fall after positive news if traders were positioned for an even better result. This is why price action after the release often matters more than the first headline.
Build a Trend Routine You Can Repeat
A sustainable routine does not require watching charts all day. Review the weekly chart over the weekend to identify major levels and broad direction. Each day, check scheduled economic events and mark the pairs most likely to move. Before the active U.S. or London session, decide which scenarios would confirm or challenge your bias.
Keep a trade journal that records more than entry and exit prices. Write down the trend direction, the economic backdrop, the technical trigger, and whether you followed your plan. Over time, the journal will show whether your best results come from breakouts, pullback entries, news volatility, or a specific pair.
Forex market trends reward traders who stay curious but disciplined. Let the macro picture shape your bias, let price action control your timing, and let risk rules protect you when the market tells a different story than the one you expected.