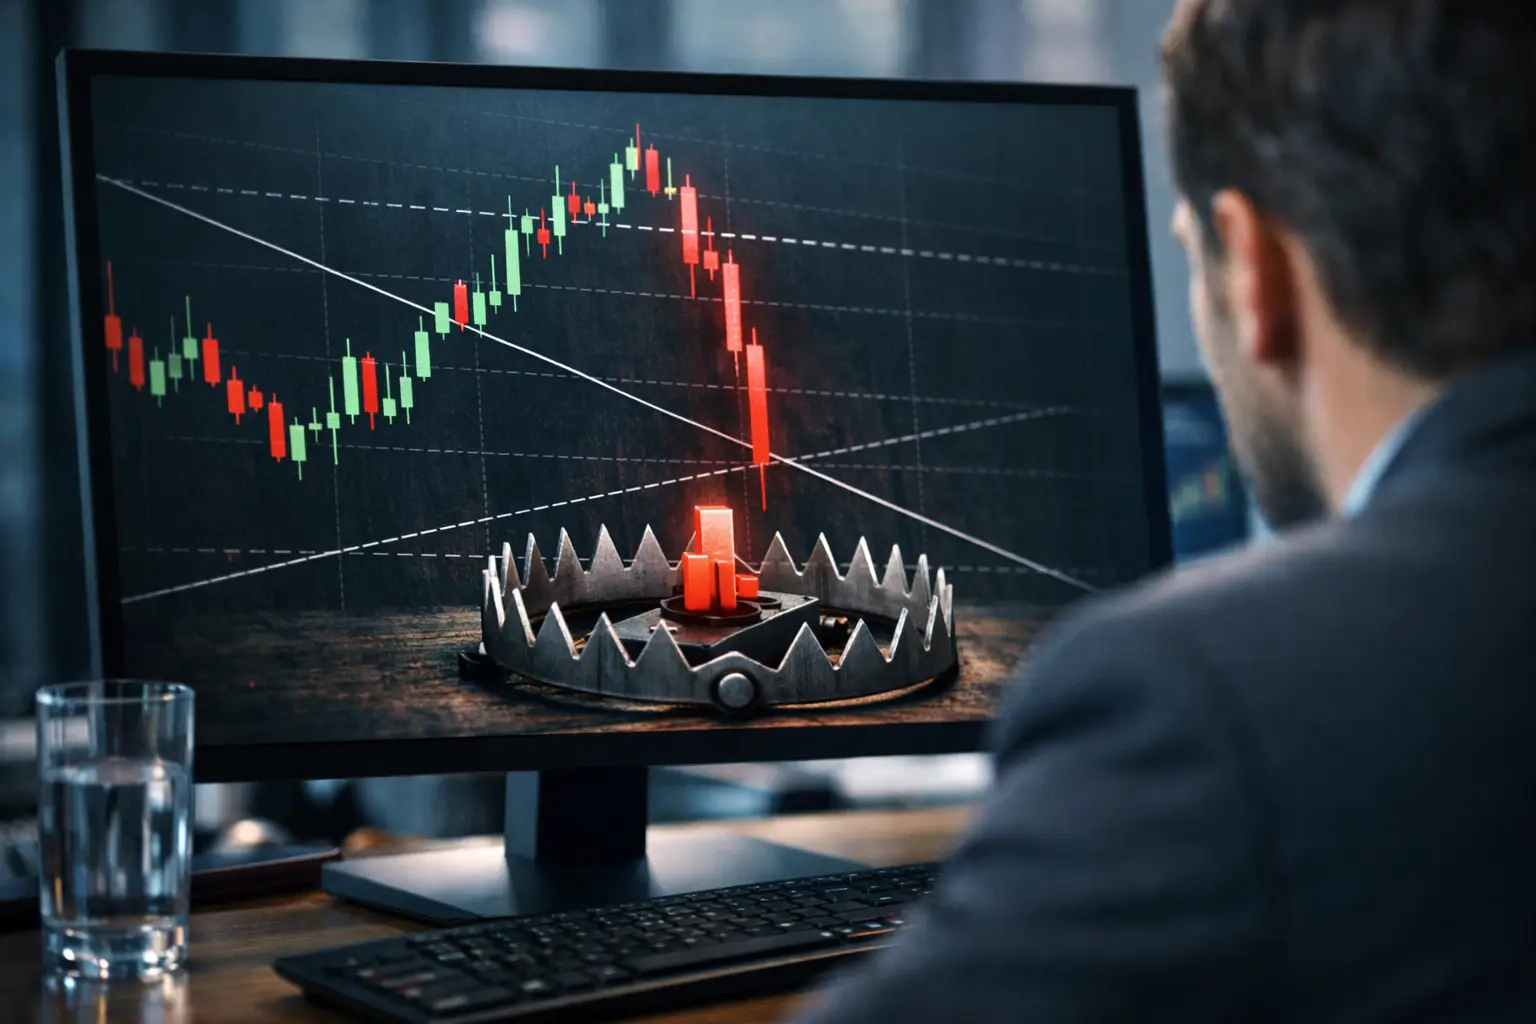
A chart can look irresistible at the moment it breaks a key level. EUR/USD clears resistance, gold pushes above a prior high, or GBP/JPY breaks a range after hours of sideways movement. Then, just as breakout traders enter, price snaps back inside the range and stops are hit. That is why learning how to identify false breakouts is less about finding a perfect indicator and more about reading whether the market has truly accepted a new price area.
- What Is a False Breakout?
- How to Identify False Breakouts With Price Action
- Look for rejection, not just a level breach
- Wait for a meaningful close outside the level
- Watch for a fast return into the range
- Use Retests to Separate Strength From Hype
- Check Volume, but Understand Forex Data
- Consider Timing, Liquidity, and Economic News
- Build the Bigger-Picture Map First
- Avoid the Most Common Breakout Mistakes
- A Practical False-Breakout Trading Plan
False breakouts are part of normal market behavior. They often occur where liquidity is concentrated: above obvious highs, below obvious lows, and around clean support and resistance levels that everyone can see. The goal is not to avoid every failed move. It is to recognize weak conditions before committing too much capital, and to manage the trade sensibly when the market proves your idea wrong.
What Is a False Breakout?
A false breakout happens when price moves beyond an established support, resistance, trendline, or range boundary, but cannot sustain trading outside that level. Price then returns into the prior structure, trapping traders who entered late in the breakout direction.
For example, imagine XAU/USD has been capped near $2,350 several times. Price briefly trades at $2,358, encouraging traders to buy the apparent breakout. If the next candles close back below $2,350 and selling accelerates, the breakout has failed. The move above resistance may have collected buy stops and triggered momentum entries, but it did not create enough demand to hold higher prices.
This matters because an initial break is only information, not confirmation. A level being touched or pierced tells you where price traveled. It does not automatically tell you where price will remain.
How to Identify False Breakouts With Price Action
The most useful evidence is usually visible on the chart itself. Rather than reacting to the first candle that crosses a level, study the candle close and the behavior immediately afterward.
Look for rejection, not just a level breach
Long wicks beyond support or resistance can signal rejection. A candle that pushes above resistance but closes back below it shows that buyers reached higher prices yet could not maintain control into the close. The opposite applies below support: a long lower wick followed by a close back above the level suggests sellers may be losing conviction.
One wick alone is not enough to trade against every breakout. During volatile sessions, especially around major data releases, wicks can be common. The stronger warning appears when rejection is followed by a second candle that confirms the return into the old range.
Wait for a meaningful close outside the level
Breakout quality improves when price closes decisively outside the level on the timeframe you are trading. A five-minute close above resistance may be relevant to a scalper, but it means very little to a swing trader using four-hour or daily charts.
Ask a simple question: did price merely poke through the level, or did it close beyond it with enough room to show acceptance? A tiny close a few pips above a major forex resistance level is less convincing than a strong-bodied candle closing well beyond it. Context matters too. A major weekly high deserves more confirmation than a minor intraday range.
Watch for a fast return into the range
One of the clearest false-breakout signals is speed. When price breaks a level and immediately falls back inside the prior range, the market is telling you the breakout side could not defend its position.
A useful rule of thumb is to monitor the next one to three candles on your entry timeframe. If the breakout is real, price may retest the level, but it should generally hold on the new side. If it rapidly closes back through the level, treat the setup with caution. That return often puts trapped traders under pressure, which can fuel a move toward the other side of the range.
Use Retests to Separate Strength From Hype
The retest is one of the most practical filters available to retail traders. After price breaks resistance, wait to see whether the former resistance becomes support. After price breaks support, watch whether the old support acts as resistance.
Suppose USD/JPY breaks above a range ceiling during the London session. Instead of buying the first surge, a patient trader waits for price to revisit the breakout zone. If buyers step in and price forms a bullish rejection candle above the former ceiling, the trade has better structure. If price falls through that level and closes back inside the range, the original breakout is likely failing.
Waiting for a retest has a trade-off. You will miss some strong moves that never pull back. But it can reduce entries taken at poor prices, shrink the distance to a logical stop-loss, and improve decision quality. For traders who struggle with FOMO, this filter is often worth more than another indicator.
Check Volume, but Understand Forex Data
In stocks and futures, strong volume on a breakout can support the case that broad participation is behind the move. A breakout on low volume is more vulnerable because fewer traders may be willing to transact at the new price.
Spot forex is decentralized, so there is no single official volume figure. Most charting platforms provide tick volume, which measures price changes or quote activity rather than total contracts traded. It can still be useful, especially when compared with recent activity on the same broker feed, but it is not definitive.
For forex traders, volume works best as supporting evidence. A breakout during an active London-New York overlap, with expanding tick activity and strong candle closes, carries more weight than a quiet late-session push through a level. In gold, oil, indices, and futures, available volume data may offer a clearer confirmation layer.
Consider Timing, Liquidity, and Economic News
Not all breakouts happen under equal conditions. A move through a key level at 2:00 a.m. Eastern Time, when liquidity can be thinner for many major pairs, deserves more skepticism than a move during a major trading session. Thin liquidity can allow price to jump through levels without creating genuine follow-through.
Economic events add another complication. U.S. CPI, Nonfarm Payrolls, FOMC decisions, and central-bank statements can produce violent first reactions that reverse within minutes. The market may initially respond to the headline, then reassess details such as wage growth, revisions, voting language, or the policy outlook.
This does not mean you should never trade news-driven breakouts. It means you need a plan suited to the volatility. Many traders are better served by waiting for the initial spike to settle, identifying the post-news range, and trading only when price shows sustained direction. Spreads, slippage, and stop execution can all worsen around high-impact releases.
Build the Bigger-Picture Map First
A breakout against the higher-timeframe trend is more likely to struggle than one aligned with it, although countertrend breaks can work when market conditions genuinely shift. Before acting on an intraday level, check the four-hour and daily charts.
If EUR/USD is in a clear daily downtrend and price breaks above a small 15-minute resistance zone, buyers may simply be taking profits or reacting to short-term news. That does not automatically make the move false, but it lowers the confidence of a long trade. Conversely, a break above a major daily range after weeks of consolidation can carry far more significance.
Also mark nearby barriers. A breakout may be technically valid but have little room before hitting the next resistance, a prior swing high, or a round number. Buying directly into that obstacle creates an unfavorable risk-to-reward profile even if the analysis is correct.
Avoid the Most Common Breakout Mistakes
The first mistake is treating every horizontal line as exact. Support and resistance are usually zones, not a single perfect price. A few pips of movement beyond a line may simply be normal market noise, particularly on volatile pairs such as GBP/JPY or during gold trading.
The second mistake is entering because one indicator flashes a signal. RSI, moving averages, and momentum tools can support an idea, but they should not replace price structure. An overbought RSI does not guarantee a false upside breakout, just as an oversold reading does not guarantee a reversal.
The third mistake is increasing position size to compensate for a late entry. If you missed the clean breakout point, do not force the trade with a tighter stop or larger lot size. Markets offer new setups every week. Protecting capital gives you the ability to take them.
A Practical False-Breakout Trading Plan
Before entering a breakout, define the level, the timeframe, and what confirmation looks like. For many traders, that means waiting for a close outside the zone, then assessing whether a retest holds. If price returns inside the range, the original breakout thesis is invalidated.
If you choose to trade the failure itself, wait for confirmation rather than blindly fading the first wick. For a failed upside break, a trader might wait for a close back below resistance, then look for a lower high or a retest of that level from below before considering a short position. The stop-loss belongs beyond the false-break high or beyond the zone where the idea is clearly wrong. Targets can be based on the range midpoint, the opposite boundary, or the next higher-timeframe support.
Keep risk consistent. A false breakout can reverse again, especially during news volatility. Risking a small, predefined portion of capital per trade matters more than being right on any single chart pattern.
The best traders do not rush to prove that a breakout is real or fake. They let price show whether it can hold the new ground. Patience around key levels may feel boring, but it is often the difference between chasing a candle and trading a well-defined decision.