A chart can look convincing right up until an oscillator flashes overbought and price keeps climbing. That is the practical problem behind RSI versus stochastic. Both tools measure momentum, both can identify stretched conditions, and both can produce expensive false entries when traders use them without reading trend and market structure first.
For forex, gold, and index traders, the better question is not which indicator is “best.” It is which indicator fits the current market condition, your trading timeframe, and the way you manage risk. RSI is often cleaner in a sustained trend. Stochastic can be sharper when price is rotating inside a range. Used with discipline, each can improve timing. Used as a standalone buy or sell button, each can create noise.
RSI versus stochastic: the core difference
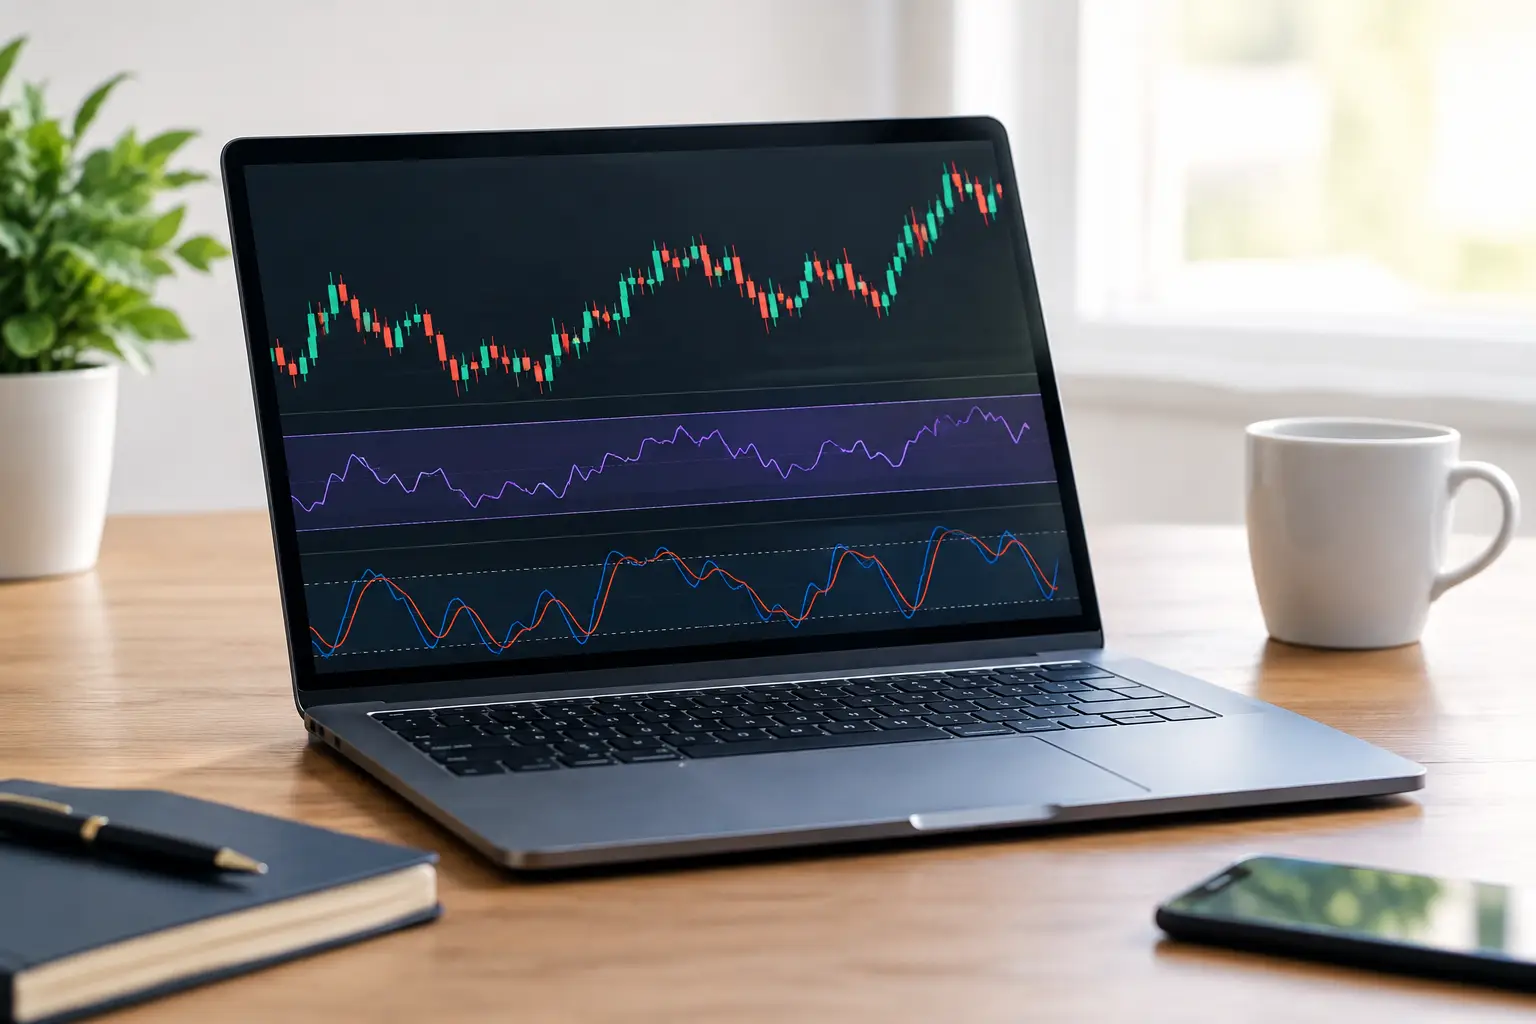
The Relative Strength Index, or RSI, measures the speed and size of recent price changes. It moves between 0 and 100, with 70 commonly treated as overbought and 30 as oversold. Its calculation compares average gains with average losses over a selected period, usually 14 candles.
The stochastic oscillator compares the latest closing price with the high-low range over a selected period. Its main line, %K, shows where price closed within that range. A smoothed signal line, %D, is often added to help traders spot momentum turns. Common reference levels are 80 for overbought and 20 for oversold.
That difference matters. RSI asks whether recent upward or downward movement has been strong. Stochastic asks whether price is closing near the top or bottom of its recent range. In a tight sideways market, that range-based view can be very useful. In a powerful trend, it can stay overbought or oversold for longer than a trader expects.
When RSI gives the clearer read
RSI is particularly useful when a market is trending and you want to judge the quality of pullbacks. Imagine EUR/USD is making higher highs and higher lows above a rising 50-period moving average. RSI may fall from 70 toward 45 or 40 during a pullback, then turn higher as buyers return. That can be more valuable than simply waiting for RSI to reach 30, which may never happen in a healthy uptrend.
This is why experienced traders often adjust how they read the levels. In a strong uptrend, RSI may repeatedly hold above 40 or 50. In a strong downtrend, it may struggle to rise above 50 or 60. These are not fixed laws, but they help traders avoid the classic mistake of selling every overbought reading in a rising market.
RSI divergence can also add context. Bearish divergence occurs when price makes a higher high while RSI makes a lower high. It suggests that upside momentum is weakening. However, weakening momentum is not the same as an immediate reversal. Price can continue higher, especially around major U.S. data, central bank decisions, or a broad risk-on move.
Treat divergence as an alert to tighten execution criteria. Look for a break below a recent swing low, a failed retest, or a bearish candle pattern at resistance before acting.
When stochastic earns its place
Stochastic is often at its best when price is clearly contained between support and resistance. If GBP/USD has spent several sessions rotating inside a defined range, a stochastic move below 20 followed by a bullish crossover can help time a potential bounce near support. Near the top of the same range, a move above 80 followed by a bearish crossover can help time a short setup.
The keyword is location. A stochastic signal in the middle of a range is usually weak because there is no obvious level for price to react from. A signal near a tested boundary, supported by candle behavior and a sensible stop-loss location, carries more practical value.
Stochastic also reacts faster than RSI in many conditions. That is an advantage for short-term traders looking at 5-minute or 15-minute charts, but speed comes with more false turns. A fast oscillator may cross several times before price makes a meaningful move. For this reason, some traders prefer the slower stochastic setting or wait for the candle to close before accepting a crossover.
The trap: overbought does not mean sell
This point deserves emphasis because it causes many avoidable losses. An overbought oscillator tells you momentum has been strong relative to the chosen calculation. It does not tell you that buyers have disappeared.
Gold provides a familiar example. During a strong move driven by falling yields, geopolitical concern, or U.S. dollar weakness, XAU/USD can remain overbought on both RSI and stochastic while continuing to rise. Selling solely because RSI is above 70 means fighting the dominant order flow without confirmation.
The same applies on the downside. An oversold reading is not proof that a falling pair has reached a bottom. A currency can stay weak for days when rate expectations shift or risk sentiment deteriorates.
Before treating an extreme reading as a reversal opportunity, ask three questions: Is price at a meaningful support or resistance zone? Has market structure changed? Is there a clear invalidation point if the setup fails? If the answer is no, the oscillator alone is not enough.
A practical way to choose between them
Start with the chart environment rather than the indicator. If price is trending, RSI usually provides the more useful framework for pullback strength, momentum failure, and trend confirmation. If price is moving sideways between visible boundaries, stochastic may offer more precise entry timing.
For a swing trader on the 4-hour or daily chart, RSI can be easier to interpret because it filters some of the rapid movement that makes stochastic noisy. For a scalper working around London or New York session liquidity, stochastic can help identify short-term momentum turns, provided the trader respects higher-timeframe direction.
There is no requirement to choose only one. Using RSI for market context and stochastic for entry timing can be effective, but only if each has a separate job. For example, a trader may decide that a 1-hour bullish trend is valid while RSI remains above 45. On the 15-minute chart, that trader waits for stochastic to turn up from an oversold area near intraday support. This is a structured process, not a search for two indicators to agree after the fact.
Settings matter, but not as much as execution
The default 14-period RSI is a sound starting point. Shorter settings such as RSI 7 react faster but generate more noise; longer settings such as RSI 21 are smoother but later. Similarly, stochastic settings such as 14,3,3 are common, while faster or slower variations change sensitivity.
Do not keep changing settings after a losing trade. That is often curve fitting disguised as optimization. Choose settings that suit your timeframe, test them across multiple market conditions, and record the results. A strategy that looks excellent during a quiet range may struggle badly when payroll data or a central bank surprise triggers a trend day.
A simple trading journal can reveal more than another indicator. Record the instrument, timeframe, market condition, oscillator reading, entry reason, stop location, and outcome. After 30 or 50 trades, patterns become easier to see. You may find that your stochastic setups work well only during Asian-session ranges, or that RSI pullback entries perform better after a higher-timeframe breakout.
Build the trade around price, not the oscillator
A workable setup begins with price structure. Mark the trend, recent swing points, support and resistance, and upcoming high-impact events. Then let RSI or stochastic answer a narrower question: Is momentum supporting this entry, fading, or stretched?
For a long trade, a logical stop belongs below the price level that proves your idea wrong, not at an arbitrary distance because the oscillator reached 20. Position size should then be adjusted to keep the amount at risk consistent. This matters more than finding a perfect indicator setting.
The strongest traders use indicators to become more selective, not more certain. RSI can prevent you from chasing a late move. Stochastic can improve timing at the edge of a range. Neither can remove uncertainty from forex or gold trading.
The next time a chart flashes an extreme reading, pause before reacting. Read the trend, identify where price sits on the chart, and decide what would invalidate the trade. That small habit turns an oscillator from a distraction into a useful trading tool.